Noir tutorial - part 5
In this section we will learn how to add some JavaScript to the application and how to use Ajax to query the service. We'll use the flot jQuery library to display the usage statistics for our site. When the page loads it will call the service which will parse today's access log and return a JSON response which will be used to generate the chart.
First, let's generate some sample usage data in the apache combined log format:
(defn gen-log-line [[cur-time]]
  (let [new-time (doto (new java.util.Date) (.setTime (+ (.getTime cur-time) (rand-int 5000))))
        browsers ["\"Mozilla/5.0 (Macintosh; Intel Mac OS X 10.7; rv:15.0) Gecko/20100101 Firefox/15.0\""
                  "\"Mozilla/5.0 (Linux; U; Android 2.2; en-gb; LG-P500 Build/FRF91) AppleWebKit/533.1 (KHTML, like Gecko)\""
                  "\"Mozilla/5.0 (X11; Linux i686) AppleWebKit/536.11 (KHTML, like Gecko) Chrome/20.0.1132.57 Safari/536.11\""]]
    [new-time
     (->>
       (concat
         (interpose "." (take 4 (repeatedly #(rand-int 255))))
         [" - - [" (.format (new java.text.SimpleDateFormat
                                  "dd/MMM/YYYY:HH:mm:ss ZZZZ") new-time) "]"]
         [" \"GET /files/test.jpg\" " 200 " " (rand-int 4000) " \"http://my-website/files/test.jpg\" " (first (shuffle browsers))])
       (apply str))]))

(defn gen-test-logs [size]
  (->> (gen-log-line [(new java.util.Date)])
    (iterate gen-log-line)
    (take size)
    (map second)
    (interpose "\n")
    (apply str)))

(spit "test-log.txt" (gen-test-logs 500))
If you run the above in the REPL, you will end up with test-log.txt file which should have the contents that look roughly like the following:
120.138.220.117 - - [31/Aug/2012:21:06:47 -0400] "GET /files/test.jpg" 200 3989 "http://my-website/files/test.jpg" "Mozilla/5.0 (Linux; U; Android 2.2; en-gb; LG-P500 Build/FRF91) AppleWebKit/533.1 (KHTML, like Gecko)"
201.59.151.159 - - [31/Aug/2012:21:06:49 -0400] "GET /files/test.jpg" 200 1729 "http://my-website/files/test.jpg" "Mozilla/5.0 (Linux; U; Android 2.2; en-gb; LG-P500 Build/FRF91) AppleWebKit/533.1 (KHTML, like Gecko)"
122.39.249.88 - - [31/Aug/2012:21:06:51 -0400] "GET /files/test.jpg" 200 1650 "http://my-website/files/test.jpg" "Mozilla/5.0 (Linux; U; Android 2.2; en-gb; LG-P500 Build/FRF91) AppleWebKit/533.1 (KHTML, like Gecko)"
...
Now that we have a log file with some access logs in it, we'll parse those logs into structured data to make them easier to analyze:
(defn round-ms-down-to-nearest-sec [date]
  (let [date (.parse
               (new SimpleDateFormat
                    "dd/MMM/yyyy:HH:mm:ss zzzzz")
               date)]
    ( * 1000 (quot (.getTime date) 1000))))

(defn parse-line [line]
  {:ip (re-find #"\b\d{1,3}\.\d{1,3}\.\d{1,3}\.\d{1,3}\b" line)
   :access-time (round-ms-down-to-nearest-sec
                  (second (re-find #"\[(.*?)\]" line))) })

(defn read-logs [file]
  (with-open [rdr (reader file)]
    (doall (map parse-line (line-seq rdr)))))
Above, we simply return a map containing the ip and the access-time for each line in the logs. Using this map we can aggregate the logs by IP to get unique hits, and then group them by time to see hits per second:
(defn hits-per-second [logs]
  (->> logs
    (group-by :ip)
    (map #(first (second %)))
    (group-by :access-time)
    (map (fn [[t hits]] [t (count hits)]))
    (sort-by first)))

(hits-per-second (read-logs "test-log.txt"))
=>([1346460948000 2] [1346460949000 1] [1346460954000 1] ...)
We now have a list where each element has a time rounded down to the nearest second with a number of unique hits associated with it. This happens to be the exact format that flot time series is expecting. We can serve the this data as JSON by using noir.response/json:
(defpage [:post "/get-logs"] params
  (response/json (hits-per-second (read-logs "test-log.txt"))))
Finally, we will have to create the page with a placeholder where our chart will be displayed and reference a Js file which will create shortly:
(defpage "/access-chart" []
  (common/basic-layout
    (include-js "/js/site.js")
    [:div#hits-by-time "loading..."]))
We will also have to add the CSS to set the height and width of the chart as well as the margin:
#hits-by-time {
        margin: 25px;
	width: 400px;
	height: 400px;
}
All that's left to do is to add the JavaScript which will get the stats and display them. To do that we'll have to download flot, and put jquery.flot.min.js in the resources/public/js folder.
Then we will include it and jQuery in the header of our page. This can be done using include-js from Hiccup. We'll open up our common namespace and modify the basic-layout as follows:
(defpartial basic-layout [& content]
  (html5
    [:head
     [:title "my-website"]
     (include-css "/css/reset.css")
     (include-js "http://code.jquery.com/jquery-1.7.2.min.js"
                 "/js/jquery.flot.min.js"
                 "/js/site.js")]
    [:body content]))
Now let's create a site.js file in resources/public/js and add the following to it:
$(document).ready(function(){
    var options = {xaxis: {mode: "time",
                           minTickSize: [1, "minute"]}};
	$.post('/get-logs', function(data){
	    $.plot($("#hits-by-time"), [data], options);
	    });
});
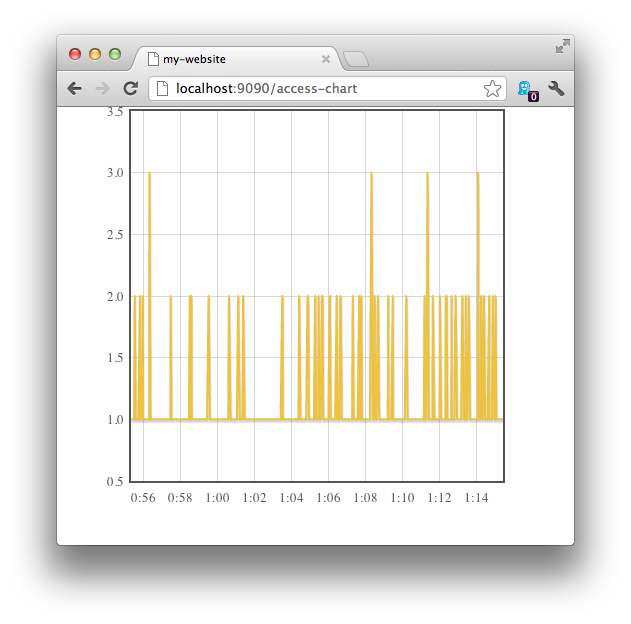
If all went well, then when we start up our site and browse to localhost:8080/access-chart. we should see something like this:

Finally, here's some fun daily stats for the blog generated using the above approach. The sources for this part of the tutorial can be found here.