Troubleshooting With JConsole
It's often useful to be able to tell how much resources your app happens to be using. I've previously discussed how JVisualVM can be used to do some basic profiling for the application. In this post we'll look at how to use another great tool called jconsole that also comes with the JVM. First, let's create and run a new Luminus web app as follows:
lein new luminus guestbook
cd guestbook
lein uberjar
java -jar target/guestbook.jar
We'll run the following command in a separate terminal:
jconsole
We should be greeted by a screen that looks something like the following:
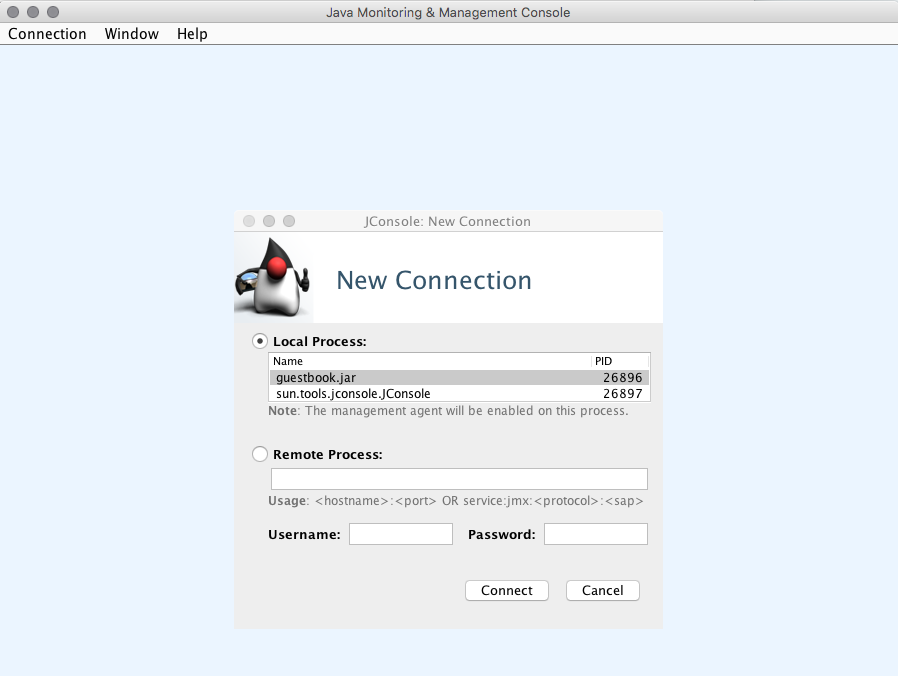
We'll select guestbook and connect to it. Once the connection is established we'll see an overview screen detailing memory, class instances, threads, and CPU usage.
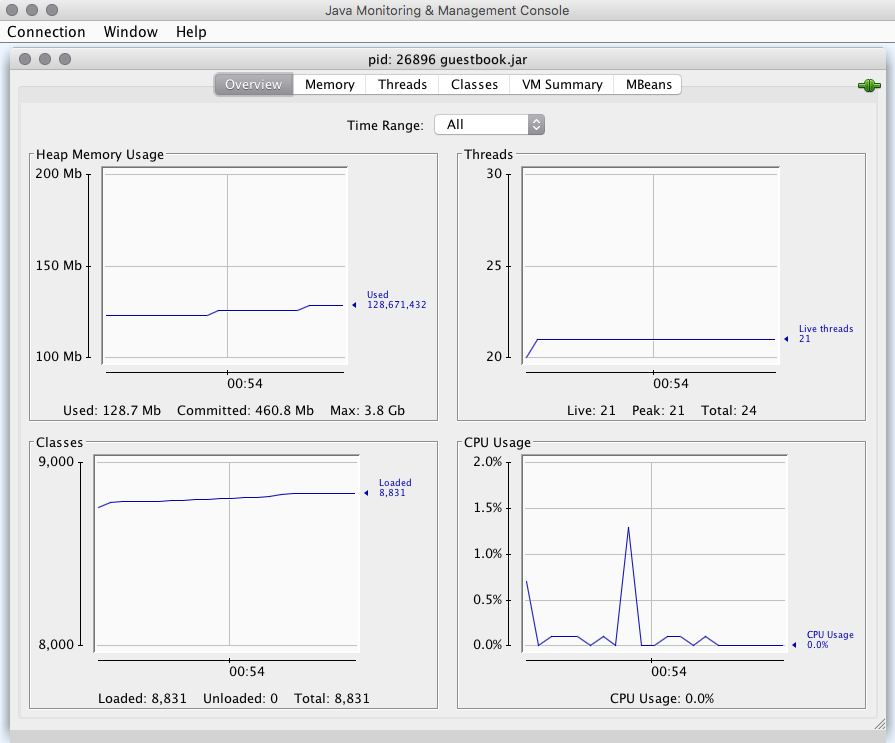
We can also select tabs to drill down into details about each of these as well as the VM summary. The Memory tab is the one of most interest to start. This screen will let us see a graph of memory usage over time and allow us to initiate garbage collection. It also shows the details about application memory usage and how it compares to the overall memory allocated by the JVM.
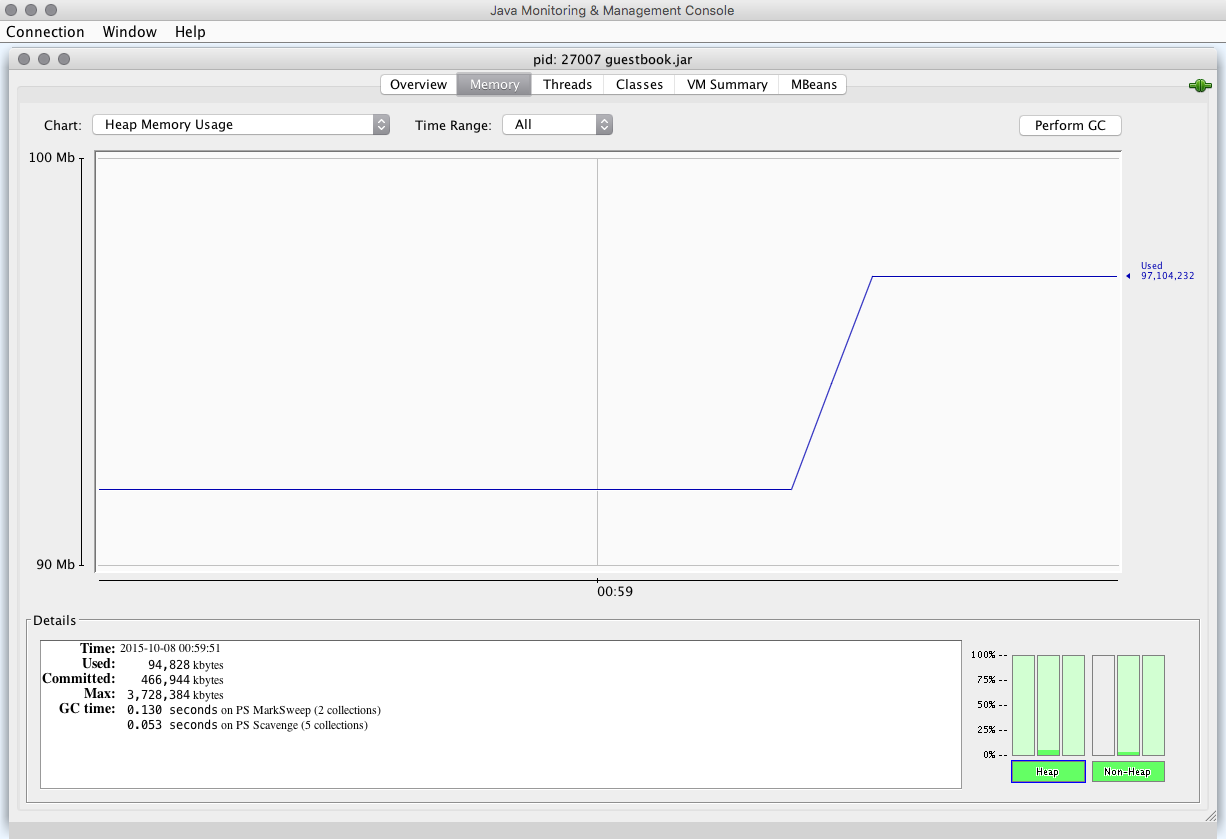
Let's run the Apache HTTP server benchmarking tool, that comes bundled by default on OS X, and see how that affects our application.
ab -c 10 -n 1000 http://127.0.0.1:3000/
This is ApacheBench, Version 2.3 <$Revision: 1663405 $>
Copyright 1996 Adam Twiss, Zeus Technology Ltd, http://www.zeustech.net/
Licensed to The Apache Software Foundation, http://www.apache.org/

Benchmarking 127.0.0.1 (be patient)
Completed 100 requests
Completed 200 requests
Completed 300 requests
Completed 400 requests
Completed 500 requests
Completed 600 requests
Completed 700 requests
Completed 800 requests
Completed 900 requests
Completed 1000 requests
Finished 1000 requests


Server Software:        undertow
Server Hostname:        127.0.0.1
Server Port:            3000

Document Path:          /
Document Length:        3918 bytes

Concurrency Level:      10
Time taken for tests:   3.544 seconds
Complete requests:      1000
Failed requests:        0
Total transferred:      4251000 bytes
HTML transferred:       3918000 bytes
Requests per second:    282.14 [#/sec] (mean)
Time per request:       35.444 [ms] (mean)
Time per request:       3.544 [ms] (mean, across all concurrent requests)
Transfer rate:          1171.26 [Kbytes/sec] received

Connection Times (ms)
              min  mean[+/-sd] median   max
Connect:        0    0   0.1      0       3
Processing:    15   35  27.4     26     252
Waiting:       15   35  26.3     26     226
Total:         15   35  27.5     26     252

Percentage of the requests served within a certain time (ms)
  50%     26
  66%     31
  75%     37
  80%     41
  90%     54
  95%     75
  98%    110
  99%    227
 100%    252 (longest request)
- note that 282 req/sec number is running without any warmup while being instrumented
We can see that as the server is getting hammered by requests the memory usage spikes from roughly a 100 megs to about 275. However, once GC is performed the memory usage goes right back down.
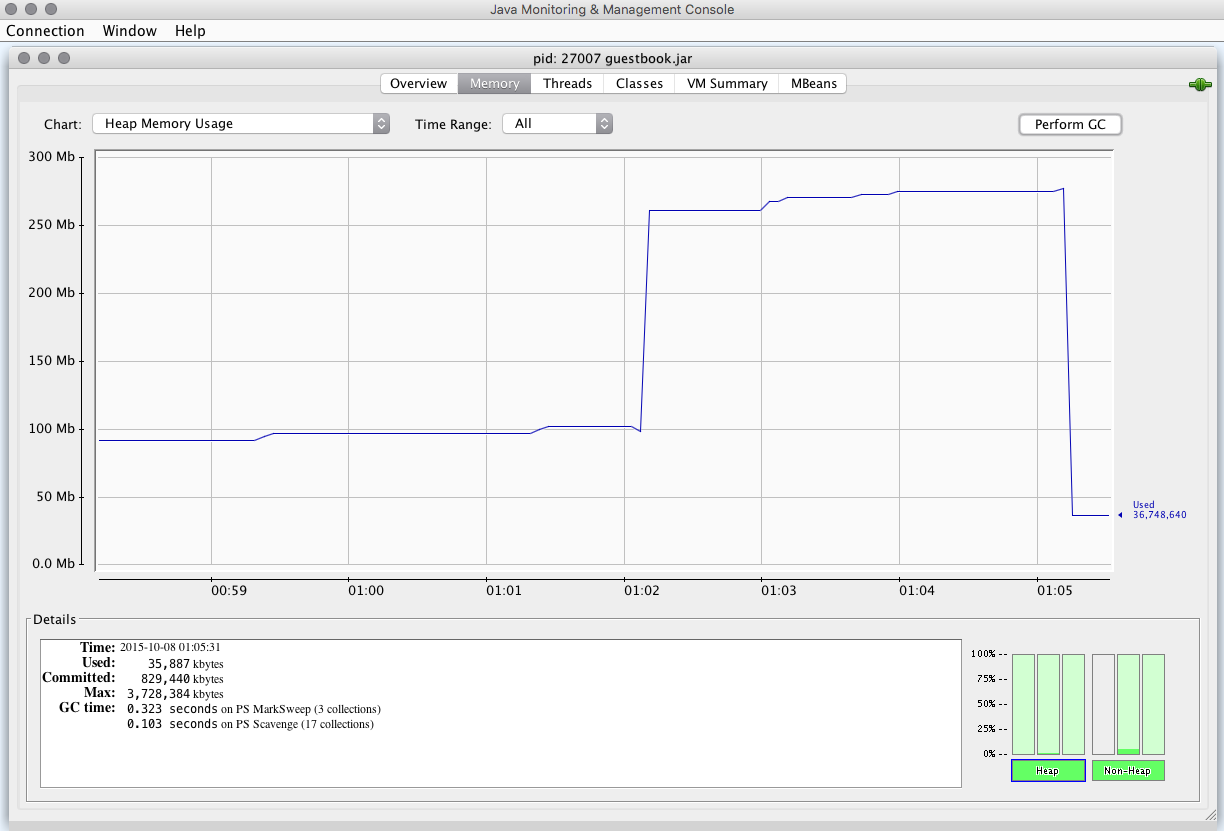
This tells us that the application starts using more resources as it serves multiple concurrent requests, but then releases these as the GC runs indicating that no memory leaks are happening. We can also confirm that the threads and class instances are not getting out of hand as the application continues to run using the the respective tabs.
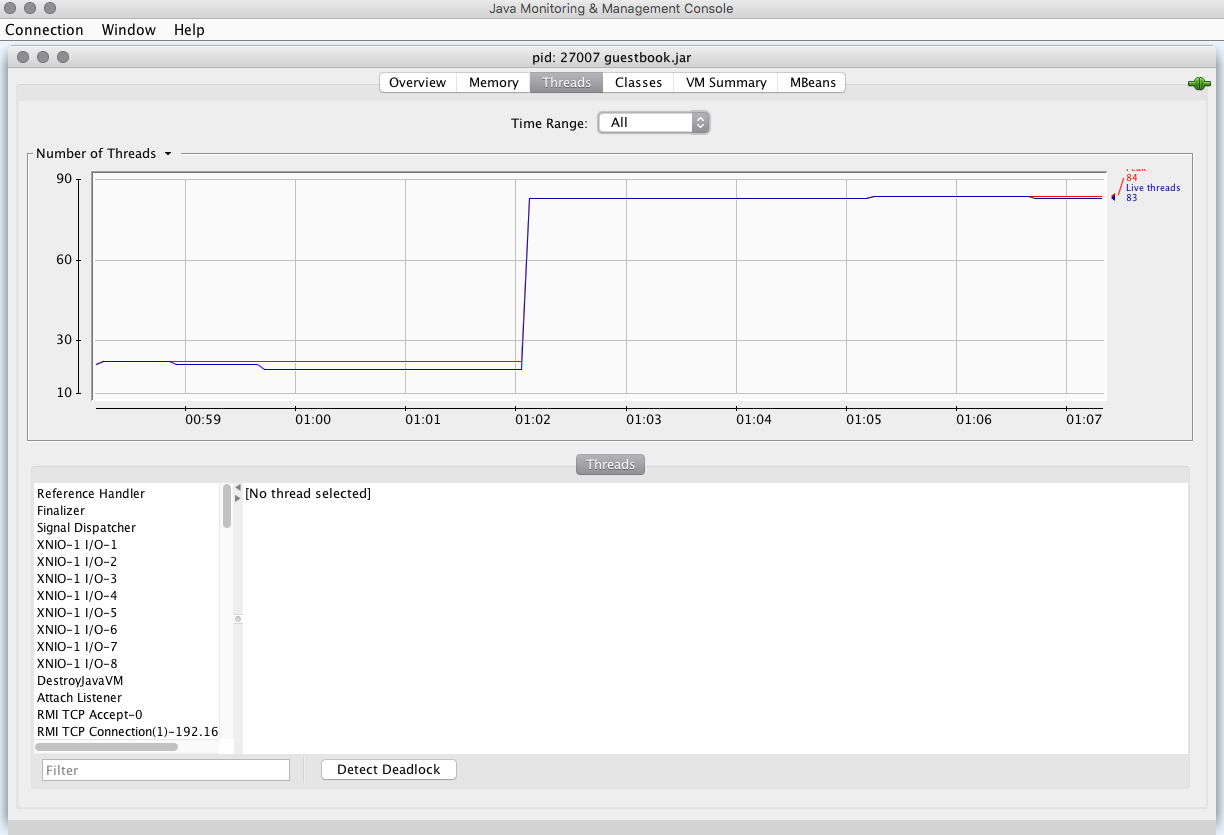
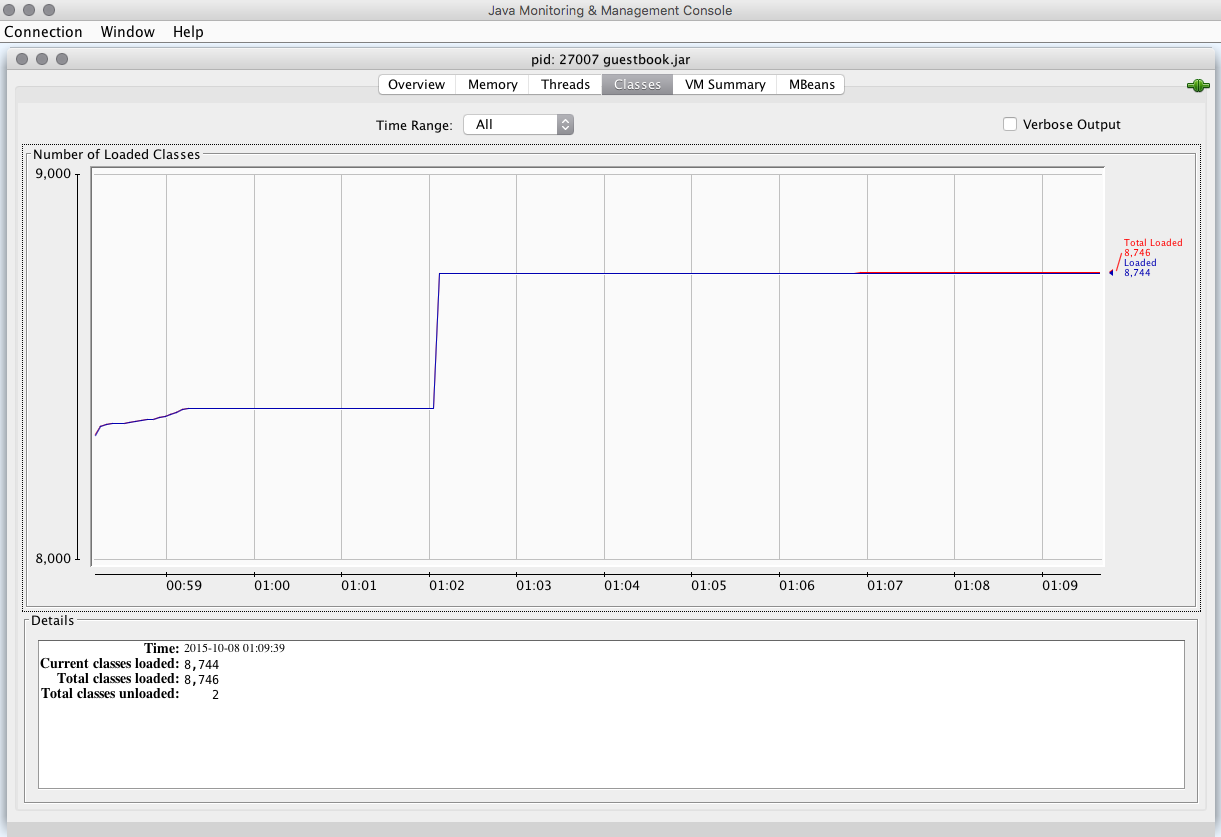
As you can see jconsole is a handy tool that can be used to quickly diagnose the behavior of a Clojure application. Should we find anything that warrants further investigation then it would be time to run a profiler such as jvisualvm to see where specifically the resources are being used.